
Thanks to our educational sponsor Etesian Technolgies for donating the equipment to make this data acquisition installation possible!

In 2011, we taught a Homebrew Wind Power class in Brownstown, Indiana at our friend George Swegles' house. We came back in 2012 to teach an Intro to Small Wind Power class, and a Wind Turbine Towers and Installation class.
One problem - During the 2011 class, we used the wind turbine power wires to rig a temporary AC outlet down by the tower so be could weld, then removed the outlet and hooked them up to the turbine. We didn't leave any power to the tower base...and it's 300 feet away from the system control center. Because of lots of lightning in the area, we didn't want to hard-wire Cat5 LAN cable that far, AND there was no room left in the underground electrical conduit.
After bullying Bill Stein at Etesian Technologies for a while for a donation, he finally got sick of us begging and donated a wireless, self-powered anemometer and data logger, just to get rid of us. (Just kidding -- Bill is a great guy!)
Self-powering the anemometer from its rotation takes a MPH or so off the minimum wind speed it can read, but because the 12-foot diameter turbine cuts in at around 6 mph, we don't care about any winds under that.
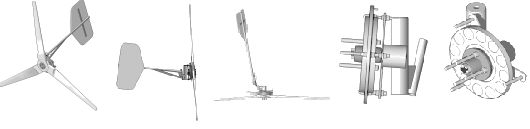
Here's the self-powered anemometer:

And here's the data logger (it writes to USB jump drives):

This is the yagi antenna near the logger, pointed at the anemometer:

George just sent us the first 2.5 months of wind data from his logger. It confirmed what we expected -- the average wind speed there is low in summer; 7 mph in April, 4.5 mph in May, and 5.3 mph in June.
BUT - George is off the grid, with the option of battery charging via the grid. His idea is to save a bit on his power bills (he also has a 1.2 kW PV array that went in the day before we installed this anemometer) BUT primarily the system is an emergency backup for when the power goes out--he wants to be able to power his stuff during even extended grid blackouts. Tornadoes came close earlier this year, and if one hit nearby the power could be out for days or weeks.
So, the data also shows that the reason average wind speed at this site is low is because of daily/weekly periods with no wind at all. When the wind is blowing, 10-minute averages are 10-15 mph, with average peak winds of 20-25 mph....and this happens almost daily. That could make a HUGE difference during an extended grid outage. George also has a "critical loads sub-panel" that lets him control what runs in the house at anytime -- has can be sure to leave things like the freezer, etc running.
Here's the first 2.5 months of wind data, blue is 10-minute average winds, orange is peak gust:
April 2012

May 2012

June 2012
